
Track your benefits. Increase the impact.
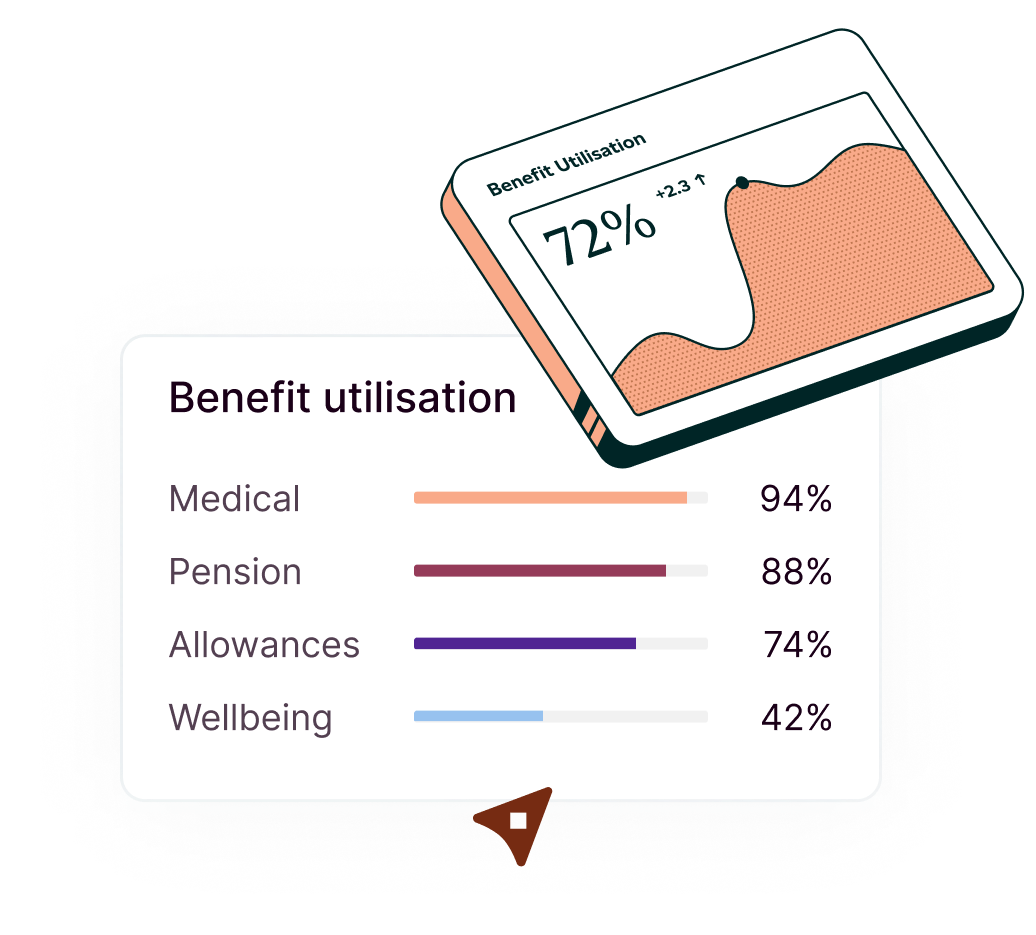
See how every benefit, allowance and reward is actually being used, across every market. Benchmark against companies like yours and get the data you need to increase engagement and ROI.












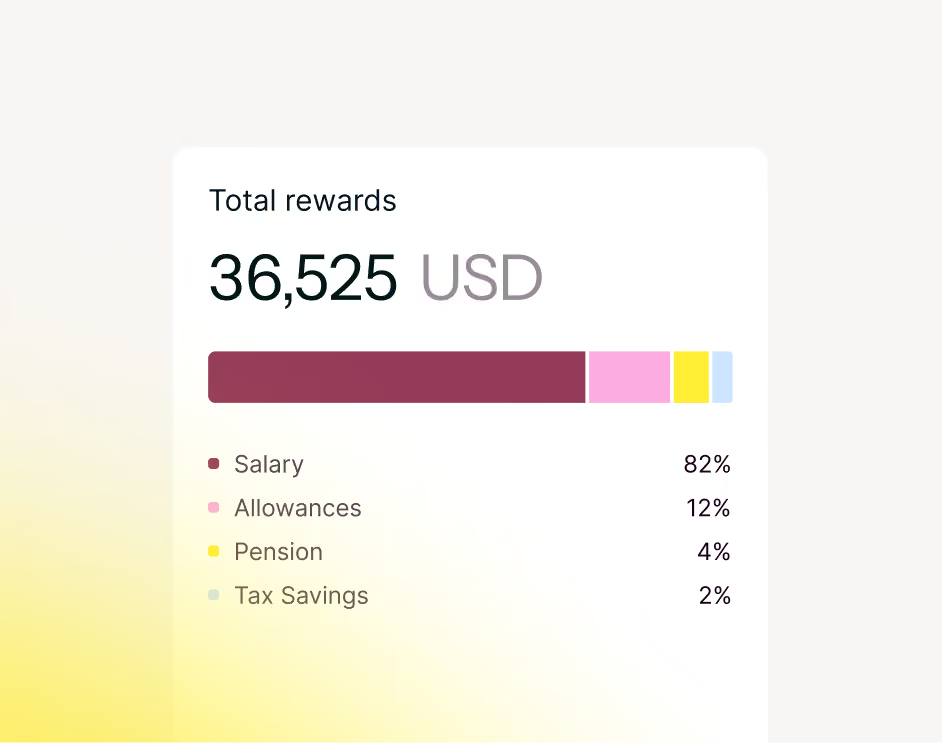
Real-time usage data, everywhere you operate
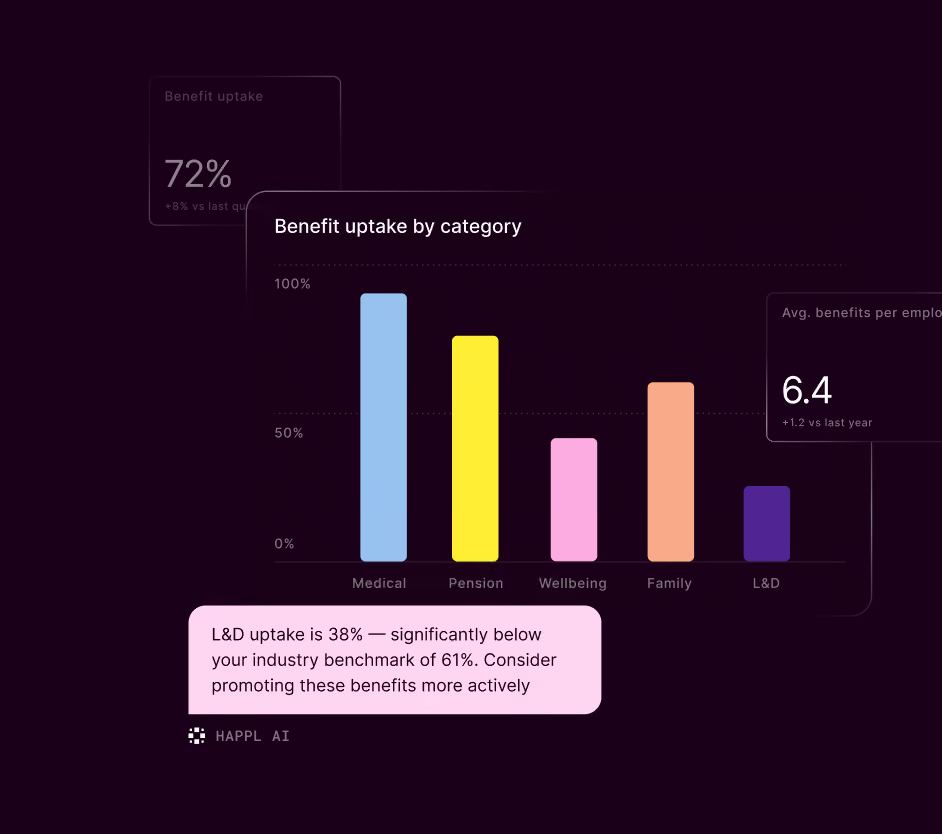
Happl gives you an accurate picture across your global benefits segments with insights into each local market.
- Monitor benefits and allowance uptake across the company and see what’s driving engagement.
- Identify unused spend, with evidence you can take straight to finance.
- Real-time reports that prove the value of benefits, not just cost.
Stay on top in a competitive market
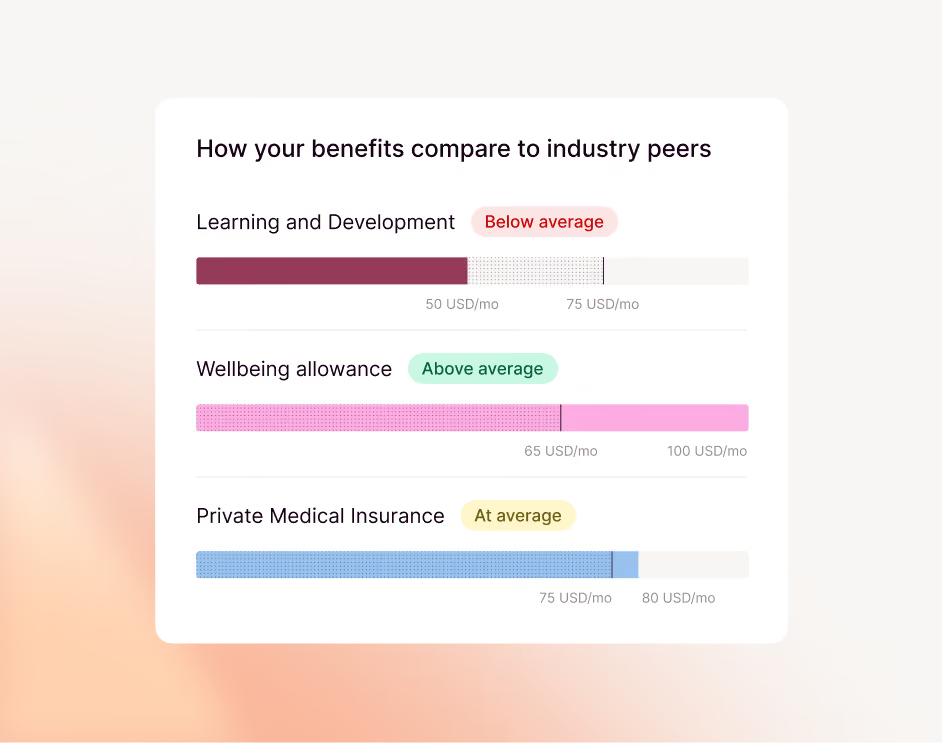
See how you compare to companies like yours. Benchmark your benefits by industry, size or funding stage, based on hundreds of thousands of data points.
- Analyse your offering, benefit by benefit, against industry standards.
- Make the case for investment, before falling behind costs you talent.
- Stay ahead of changes with insights that update as the market moves.
Turn data into decisions using your own AI
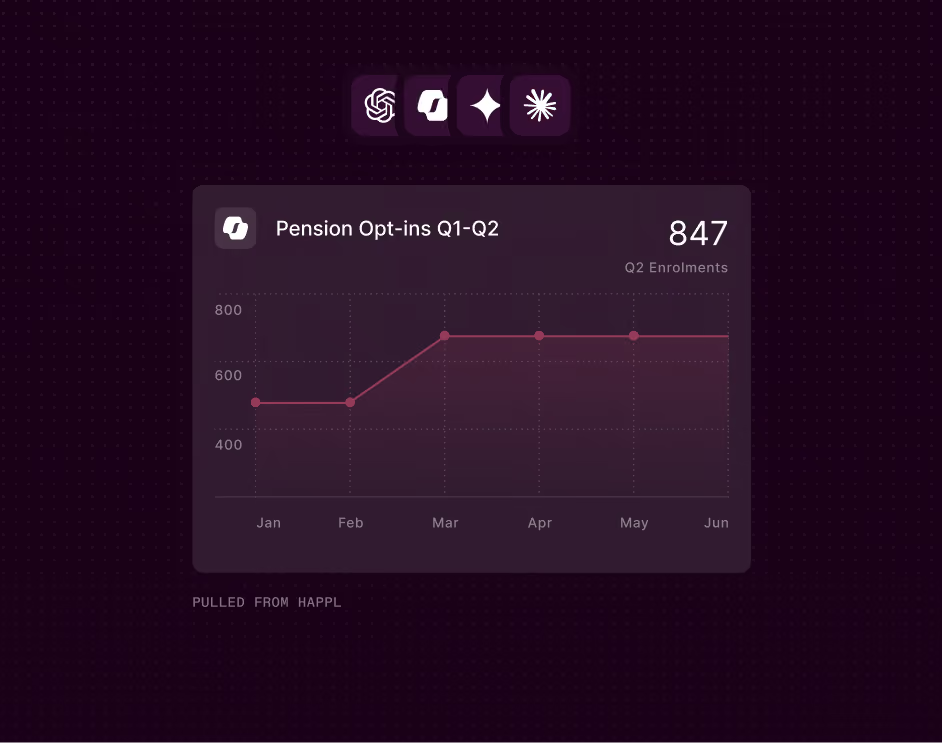
Get more from your data. Connect your own AI or get recommendations from Happl AI based on engagement, spend and industry standards.
- Connect to the AI tools you already use with MCP and ask about your benefits data directly.
- Get recommendations specific to your business and industry.
- Generate finance-ready reports and presentations, straight from your benefits data, in your own enterprise AI such as Copilot, Claude, Gemini or ChatGPT.
Discover savings and swap with ease
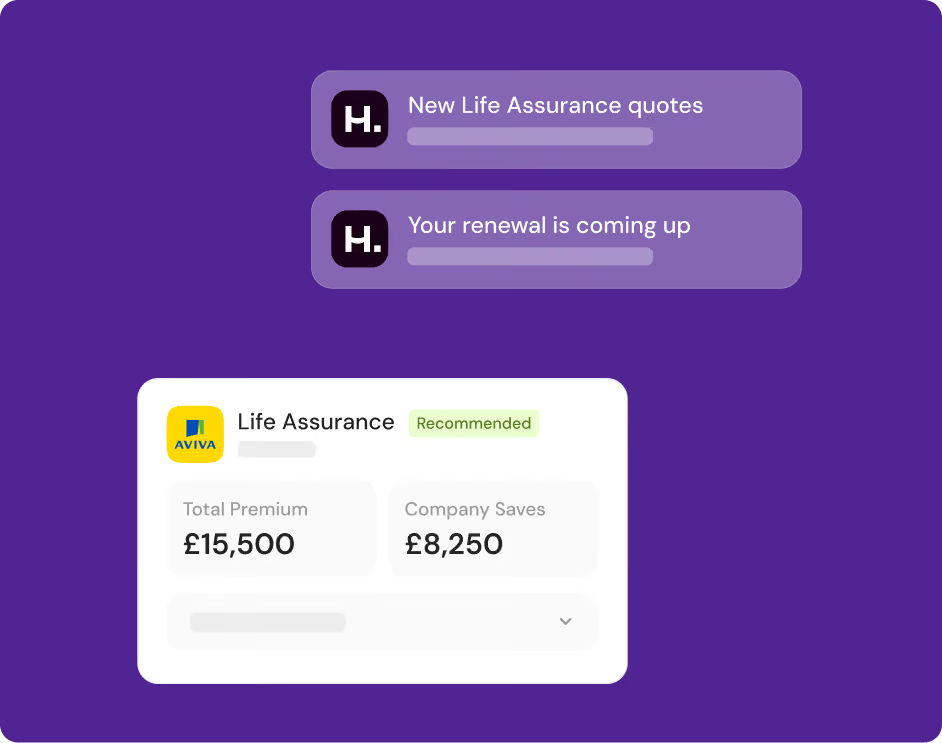
Identify cost savings in your current package, then let our dedicated team find you cheaper solutions, negotiate better prices and suggest initiatives to level-up your engagement offering.
- Cheaper cover, found without going to market yourself.
- Better pricing, negotiated directly with your providers.
- New ideas to boost engagement, based on real market insights.
Prove the value, not just the cost.
Book a demo to see how Happl turns your benefits data into the evidence for your next budget conversation.